What's the Matter with Staten Island?
 Over the past two years, the north shore community of Staten Island had more children placed in foster care than any other community district in New York City, according to a Child Welfare Watch analysis of Administration for Children’s Services (ACS) data. In 2010, the neighborhoods of St. George and Stapleton, near the Staten Island ferry, had the unfortunate distinction of having more children placed in foster care than any other. In 2011, the district ranked second citywide.
The total number of children placed in foster care dropped sharply last year across the city, from more than 7,000 in 2010 to under 5,700 last year. There was a substantial decline in St. George and Stapleton as well, from 361 placements to 273. Nonetheless, the community district remains just below the top of the list.
What’s clear in the city’s 2010 data is that, when child protective investigators in these Staten Island neighborhoods decided they had reason to believe abuse or neglect may have occurred, a child had a nearly one-third one-fourth chance of being placed in foster care. This is a rate higher than any other New York City neighborhood with substantial involvement in the child welfare system.
Citywide, just over 19 percent 15 percent of “indicated cases”— where investigators have determined sufficient reason to suspect child abuse or neglect—led to a child being placed in foster care. In the remaining cases, children remained with their families, often receiving services and supports such as parenting classes, child care or counseling.
High rates of isolation and poverty and a philosophy of protecting children by removing them from home all contribute to the frequent placements, according to many who work in child welfare here.
“I think everyone who works in Staten Island knows how overprotective the system is,” says Jody Bahar, an attorney who represents Staten Island parents in Family Court. “We’re going to take the kids. That’s what we do here.”
Others cite a lack of institutional supports for low-income residents. “You have very poor people, and the demographic is very depressed economically, and [it doesn’t have] services that other parts of Staten Island have,” says Ralph Porzio, also an attorney for parents and a former Family Court judge. Porzio adds that services such as subsidized daycare can have a positive snowball effect for families, with one service connecting them to other local resources and supports.
Indeed, there are several thousand young children in these neighborhoods who are eligible for but not receiving subsidized child care—but this is true in most of the city’s low-income communities.
Where the northern Staten Island community district stands out, however, is the high rate of abuse and neglect reporting, and the path taken by these cases once they are investigated. Some activists say that child protective staff are too aggressive in their decision to seek removal.
“It’s the philosophy and the thinking of the administration. You have some very pro-removal people in charge,” says Fola Campbell, executive director of the Staten Island Council of Child Abuse and Neglect. She says that the tendency to remove reflects the second-class status of the St. George and Stapleton communities, which have many immigrants and families of color, within an otherwise conservative, largely white borough.
Whether it's for conscious or unconscious reasons, “ACS will take a harder-line stance on those people who are poor and those people who are of color,” says Porzio. As in the rest of the city, Staten Island Family Court usually goes along with ACS child protective investigators’ recommendations to remove children.
“You need someone who is not only going to be remarkably diligent, but remarkably strong of character to say that this is the recommendation from ACS and I’m going to go against it,” says Porzio.
The motives may not be bad, says attorney Jody Bahar. “It’s for altruistic reasons, I do believe that… [Child protective workers] want children to be in a home like their home would be.” Still, she says, “My view is that we take the child too quickly.”
In response to a request for comment, ACS said in a written statement: “It is our goal to keep families intact and advocate for a child’s removal only when we believe there to be imminent risk to the child’s life or health.”
UPDATE AND CORRECTION-JULY 6
Our analysis of ACS data comparing indication rates and placement of children in foster care contained an error, although the overall analysis is accurate. Here are the correct numbers: Among city neighborhoods with the greatest number of children entering foster care in 2010, Staten Island's Community District 1 (the neighborhoods of St. George and Stapleton) tops the list in the percentage of children with indicated cases that are placed. When child protective investigators in these Staten Island neighborhoods decided they had reason to believe a child may have been abused or neglected, that child had a 24 percent chance of being placed in foster care. Central Harlem came in a close second, with nearly 23 percent of children with indicated cases getting placed.
In Bushwick, by comparison, about one in 10 children with an indicated case is placed in foster care.
Our original analysis failed to account for the number of children placed into foster care for reasons other than abuse and neglect (such as children whose parents placed them in care voluntarily). The corrected data are below in Table 1, which lists the neighborhoods with a high number of placements.
The ACS uses a different method to measure the outcomes of child protective investigations that are indicated—that is, when the investigator believed there was reason to suspect abuse or neglect had taken place. Below, Table 2 shows the number of indicated investigations that led to a foster care placement of any child in the family, within two months of the conclusion of the investigation. Using this methodology, one placement can represent one or more children being placed from the same family. Central Harlem and Staten Island remain in the top three for the highest percentage of cases that result in placements.
Table 1: Percent of Children in Indicated Reports Placed in Foster Care
(Top 10 community districts plus Jamaica and Bushwick, and five boroughs)
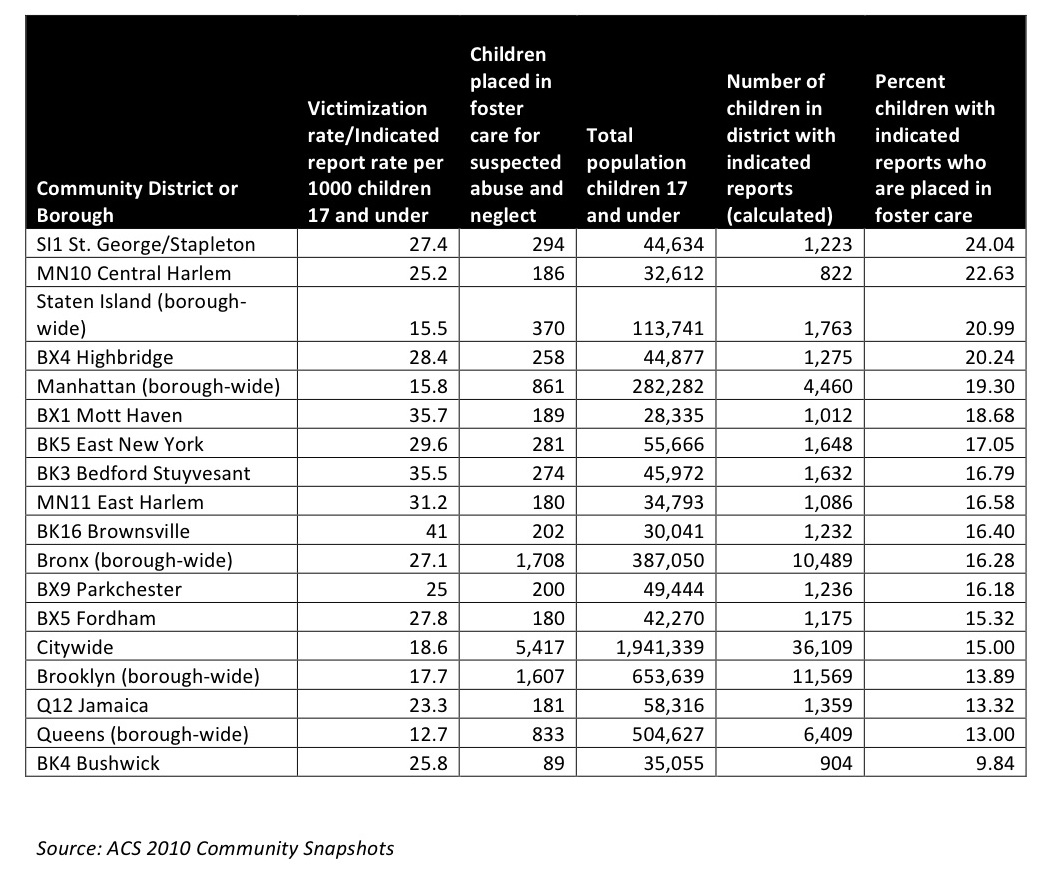
Table 2: Indicated Investigations with Foster Care Placement, FY 2011
(Includes placements made within two months of conclusion of investigation)
| CD |
Foster Care Placement |
Total Indicated Cases |
|
| BX1 - Mott Haven/Melrose |
74 |
11.6% |
640 |
| BX2 - Hunts Point/Longwood |
70 |
16.7% |
418 |
| BX3 - Morrisania/Crotona |
82 |
13.5% |
608 |
| BX4 - Concourse/Highbridge |
108 |
14.5% |
747 |
| BX5 - Fordham/University Heights |
96 |
13.4% |
714 |
| BX6 - Belmont/East Tremont |
98 |
14.6% |
669 |
| BX7 - Kingsbridge Hghts/Bedford |
72 |
12.7% |
567 |
| BX8 - Riverdale/Fieldston |
18 |
11.9% |
151 |
| BX9 - Parkchester/Soundview |
105 |
13.1% |
802 |
| BX10 - Throgs Neck/Coop City |
23 |
9.5% |
242 |
| BX11 - Morris Park/Bronxdale |
32 |
9.7% |
330 |
| BX12 - Williamsbridge/Baychester |
86 |
14.5% |
595 |
| BX - Unknown CD |
22 |
20.2% |
109 |
| BX - Total |
886 |
13.4% |
6,592 |
| BK1 - Williamsburg/Greenpoint |
33 |
10.3% |
320 |
| BK2 - Fort Greene/Brooklyn Hts |
33 |
16.0% |
206 |
| BK3 - Bedford Stuyvesant |
160 |
15.2% |
1,053 |
| BK4 - Bushwick |
63 |
12.7% |
495 |
| BK5 - East New York/Starrett City |
145 |
13.3% |
1,090 |
| BK6 - Park Slope/Carroll Gardens |
18 |
11.4% |
158 |
| BK7 -Sunset Park |
13 |
4.6% |
280 |
| BK8 - Crown Heights North |
53 |
14.3% |
370 |
| BK9 - Crown Heights South/Prospect |
33 |
13.1% |
252 |
| BK10 - Bay Ridge/Dyker Hghts |
9 |
6.4% |
140 |
| BK11 - Bensonhurst |
19 |
9.1% |
209 |
| BK12 - Borough Park |
16 |
8.3% |
193 |
| BK13 - Coney Island |
33 |
10.2% |
322 |
| BK14 - Flatbush/Midwood |
27 |
6.8% |
397 |
| BK15 - Sheepshead Bay |
9 |
4.5% |
201 |
| BK16 - Brownsville |
138 |
17.8% |
775 |
| BK17 - East Flatbush |
73 |
13.5% |
542 |
| BK18 - Flatlands/Canarsie |
42 |
11.1% |
380 |
| BK - Unknown CD |
51 |
22.0% |
232 |
| BK - Total |
968 |
12.7% |
7,615 |
| MN1 - Financial District |
3 |
13.6% |
22 |
| MN2 - Greenwich Village/Soho |
- |
0.0% |
15 |
| MN3 - Lower East Side/Chinatown |
73 |
18.8% |
389 |
| MN4 - Clinton/Chelsea |
21 |
21.0% |
100 |
| MN5 - Midtown |
11 |
19.3% |
57 |
| MN6 - Stuyvesant Town/Turtle Bay |
9 |
17.0% |
53 |
| MN7 - Upper West Side |
29 |
13.6% |
213 |
| MN8 - Upper East Side |
13 |
13.3% |
98 |
| MN9 - Morningside Heights/Hamilton |
65 |
17.3% |
376 |
| MN10 - Central Harlem |
98 |
18.9% |
519 |
| MN11 - East Harlem |
127 |
18.6% |
683 |
| MN12 - Washington Heights/Inwood |
54 |
12.6% |
428 |
| MN - Unknown CD |
21 |
19.4% |
108 |
| MN - Total |
524 |
17.1% |
3,061 |
| QN1 - Astoria |
43 |
12.8% |
335 |
| QN2 - Sunnyside/Woodside |
12 |
8.4% |
143 |
| QN3 - Jackson Heights |
27 |
7.4% |
364 |
| QN4 - Elmhurst/Corona |
18 |
5.1% |
351 |
| QN5 - Ridgewood/Maspeth |
7 |
2.5% |
280 |
| QN6 - Rego Park/Forest Hills |
1 |
1.9% |
54 |
| QN7 - Flushing/Whitestone |
22 |
10.2% |
215 |
| QN8 - Fresh Meadows/Hillcrest |
16 |
12.1% |
132 |
| QN9 - Ozone Park/Woodhaven |
31 |
9.8% |
315 |
| QN10 - South Ozone Park/Howard Beach |
22 |
10.7% |
205 |
| QN11 - Bayside/Little Neck |
4 |
6.7% |
60 |
| QN12 - Jamaica/Hollis |
96 |
12.0% |
799 |
| QN13 - Queens Village |
53 |
13.5% |
394 |
| QN14 - Rockaway/Broad Channel |
60 |
11.5% |
521 |
| QN - Unknown CD |
18 |
18.9% |
95 |
| QN - Total |
430 |
10.1% |
4,263 |
| SI1 - Saint George/Stapleton |
118 |
18.2% |
650 |
| SI2 - South Beach/Willowbrook |
22 |
13.5% |
163 |
| SI3 - Tottenville/Great Kills |
17 |
11.3% |
151 |
| SI - Unknown CD |
14 |
20.9% |
67 |
| SI - Total |
171 |
16.6% |
1,030 |
| NYC |
2,979 |
13.2% |
22,564 |
| Source: ACS | |||